Reporting
Monitor progress through KPIs
The Reporting Dashboard provides managers with key insights into project performance, offering real-time data on work speed and the emergence of unexpected tasks and issues. With customizable timeframes, you can easily track progress, identify bottlenecks, and make data-driven decisions to keep your project on track and within scope.
- Compare timeframes:
- You can choose between today, the current week, and the last 14 or 30 days. Besides the current KPI, you can also see its adjustment relative to the past timeframe.
- Filter by inventory:
- Instead for the whole Rollout project, you can also check the KPIs individually per inventory.
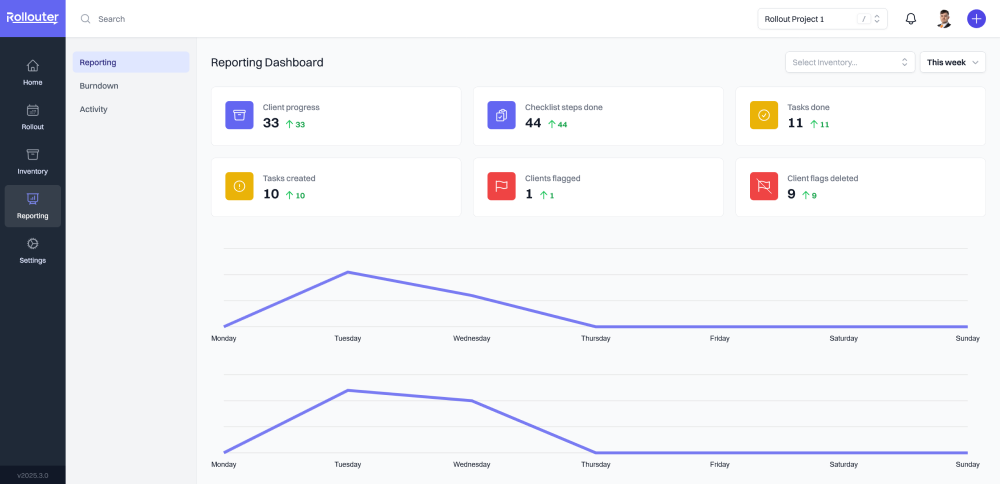
Additional charts
Thanks to a wide range of tools, the evaluation of your project is not only taken off your hands, but also clearly displayed for presentations.
Inventory Dashboard
Built for effortless status reports
Use client groups to view inventory structure and track progress.
Burndown Charts
Will you reach your milestones in time?
Track the progress against targets and evaluate your project's status with confidence.