Burndown Charts
Meet milestones or counteract in time
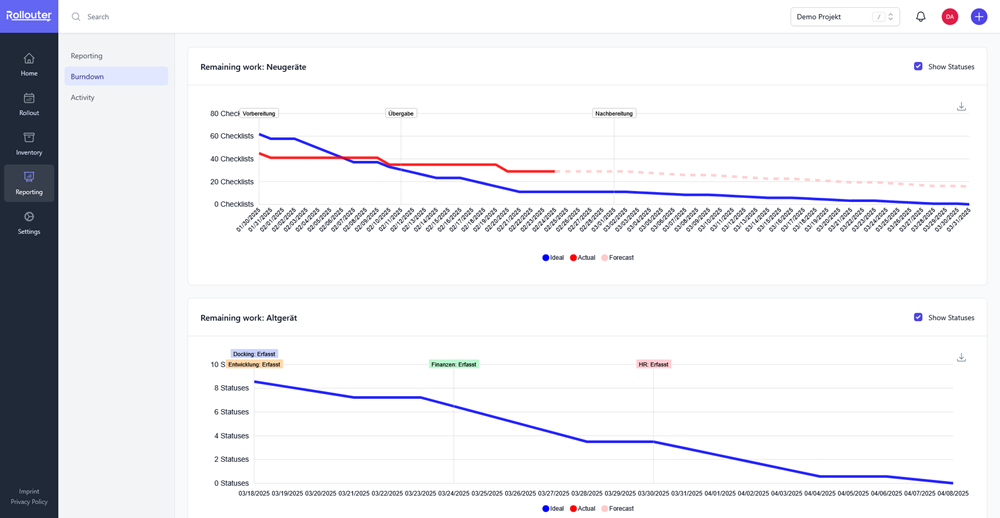
Burndown charts measure the currently remaining effort in real-time, in contrast to the ideal remaining effort, according to the timeframe defined in the inventory's roadmap.
- Forecast:
- A forecast is made based on your team's performance since the start of the Rollout. With every passing day, the forecast becomes more precise.
- Define working days:
- Define on which week days your team will work on the project. The chart will consider absent days in both ideal and forecast lines.